Loading
![]()
![]()
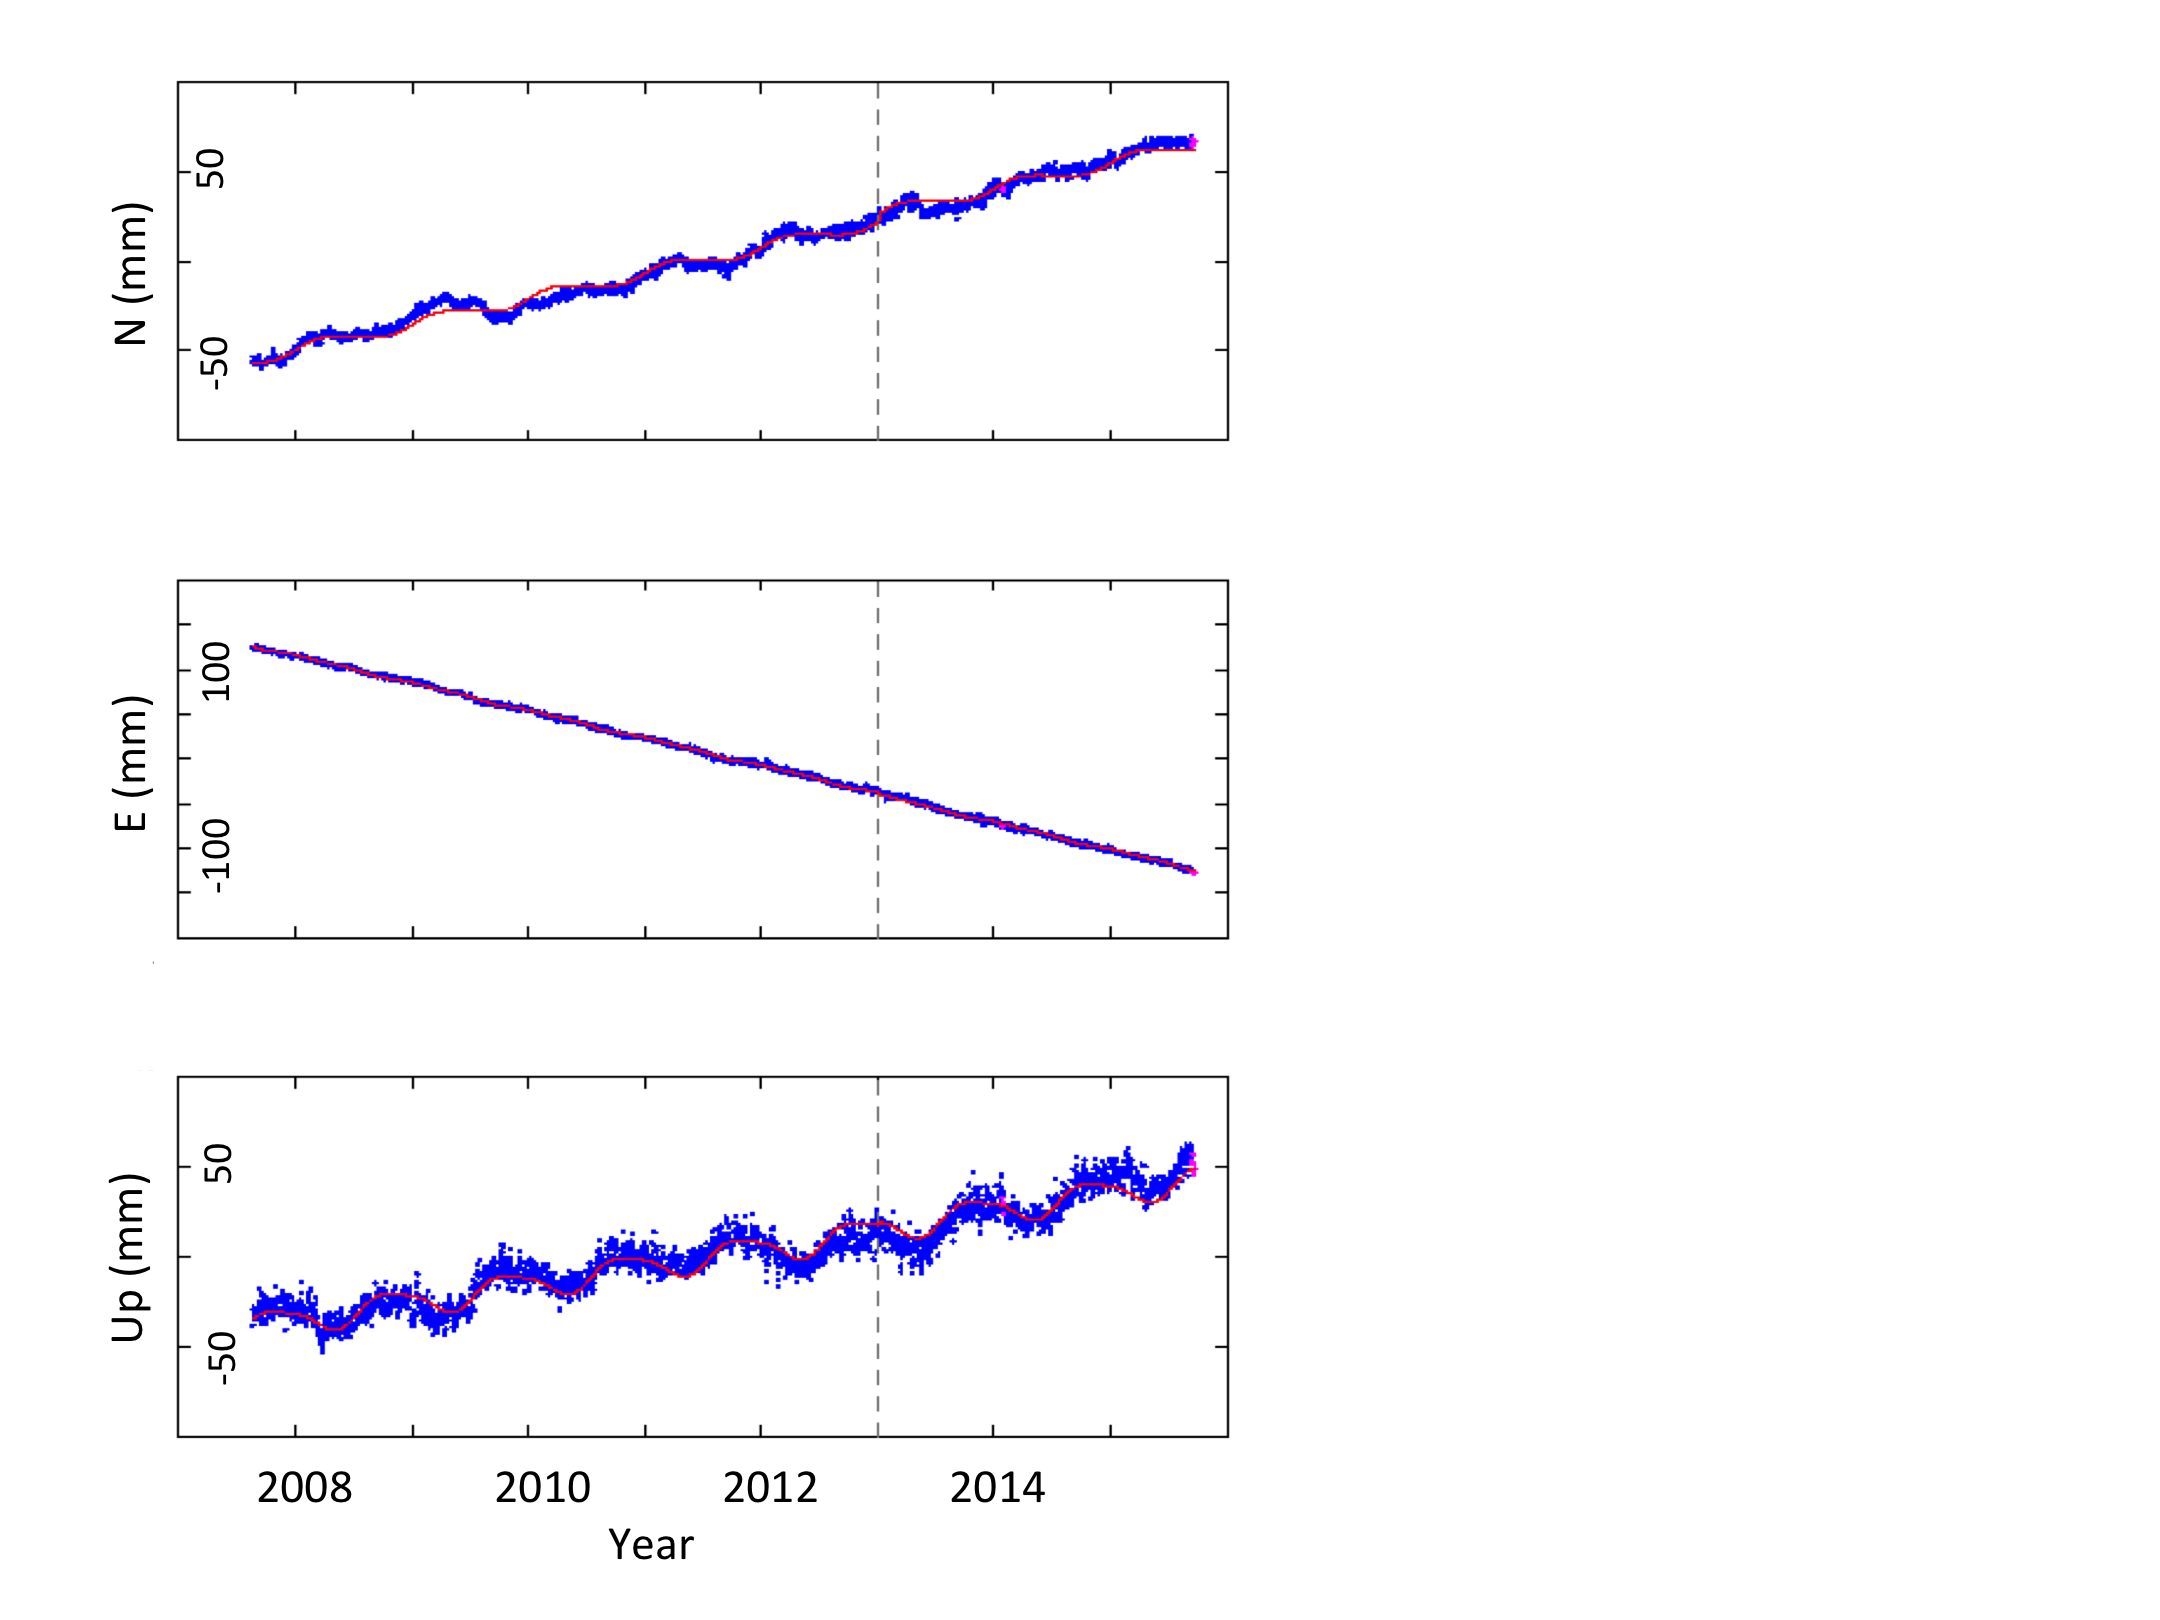
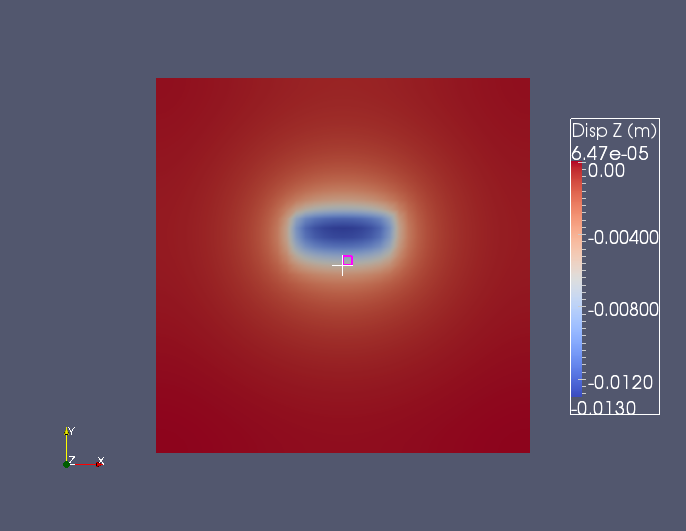
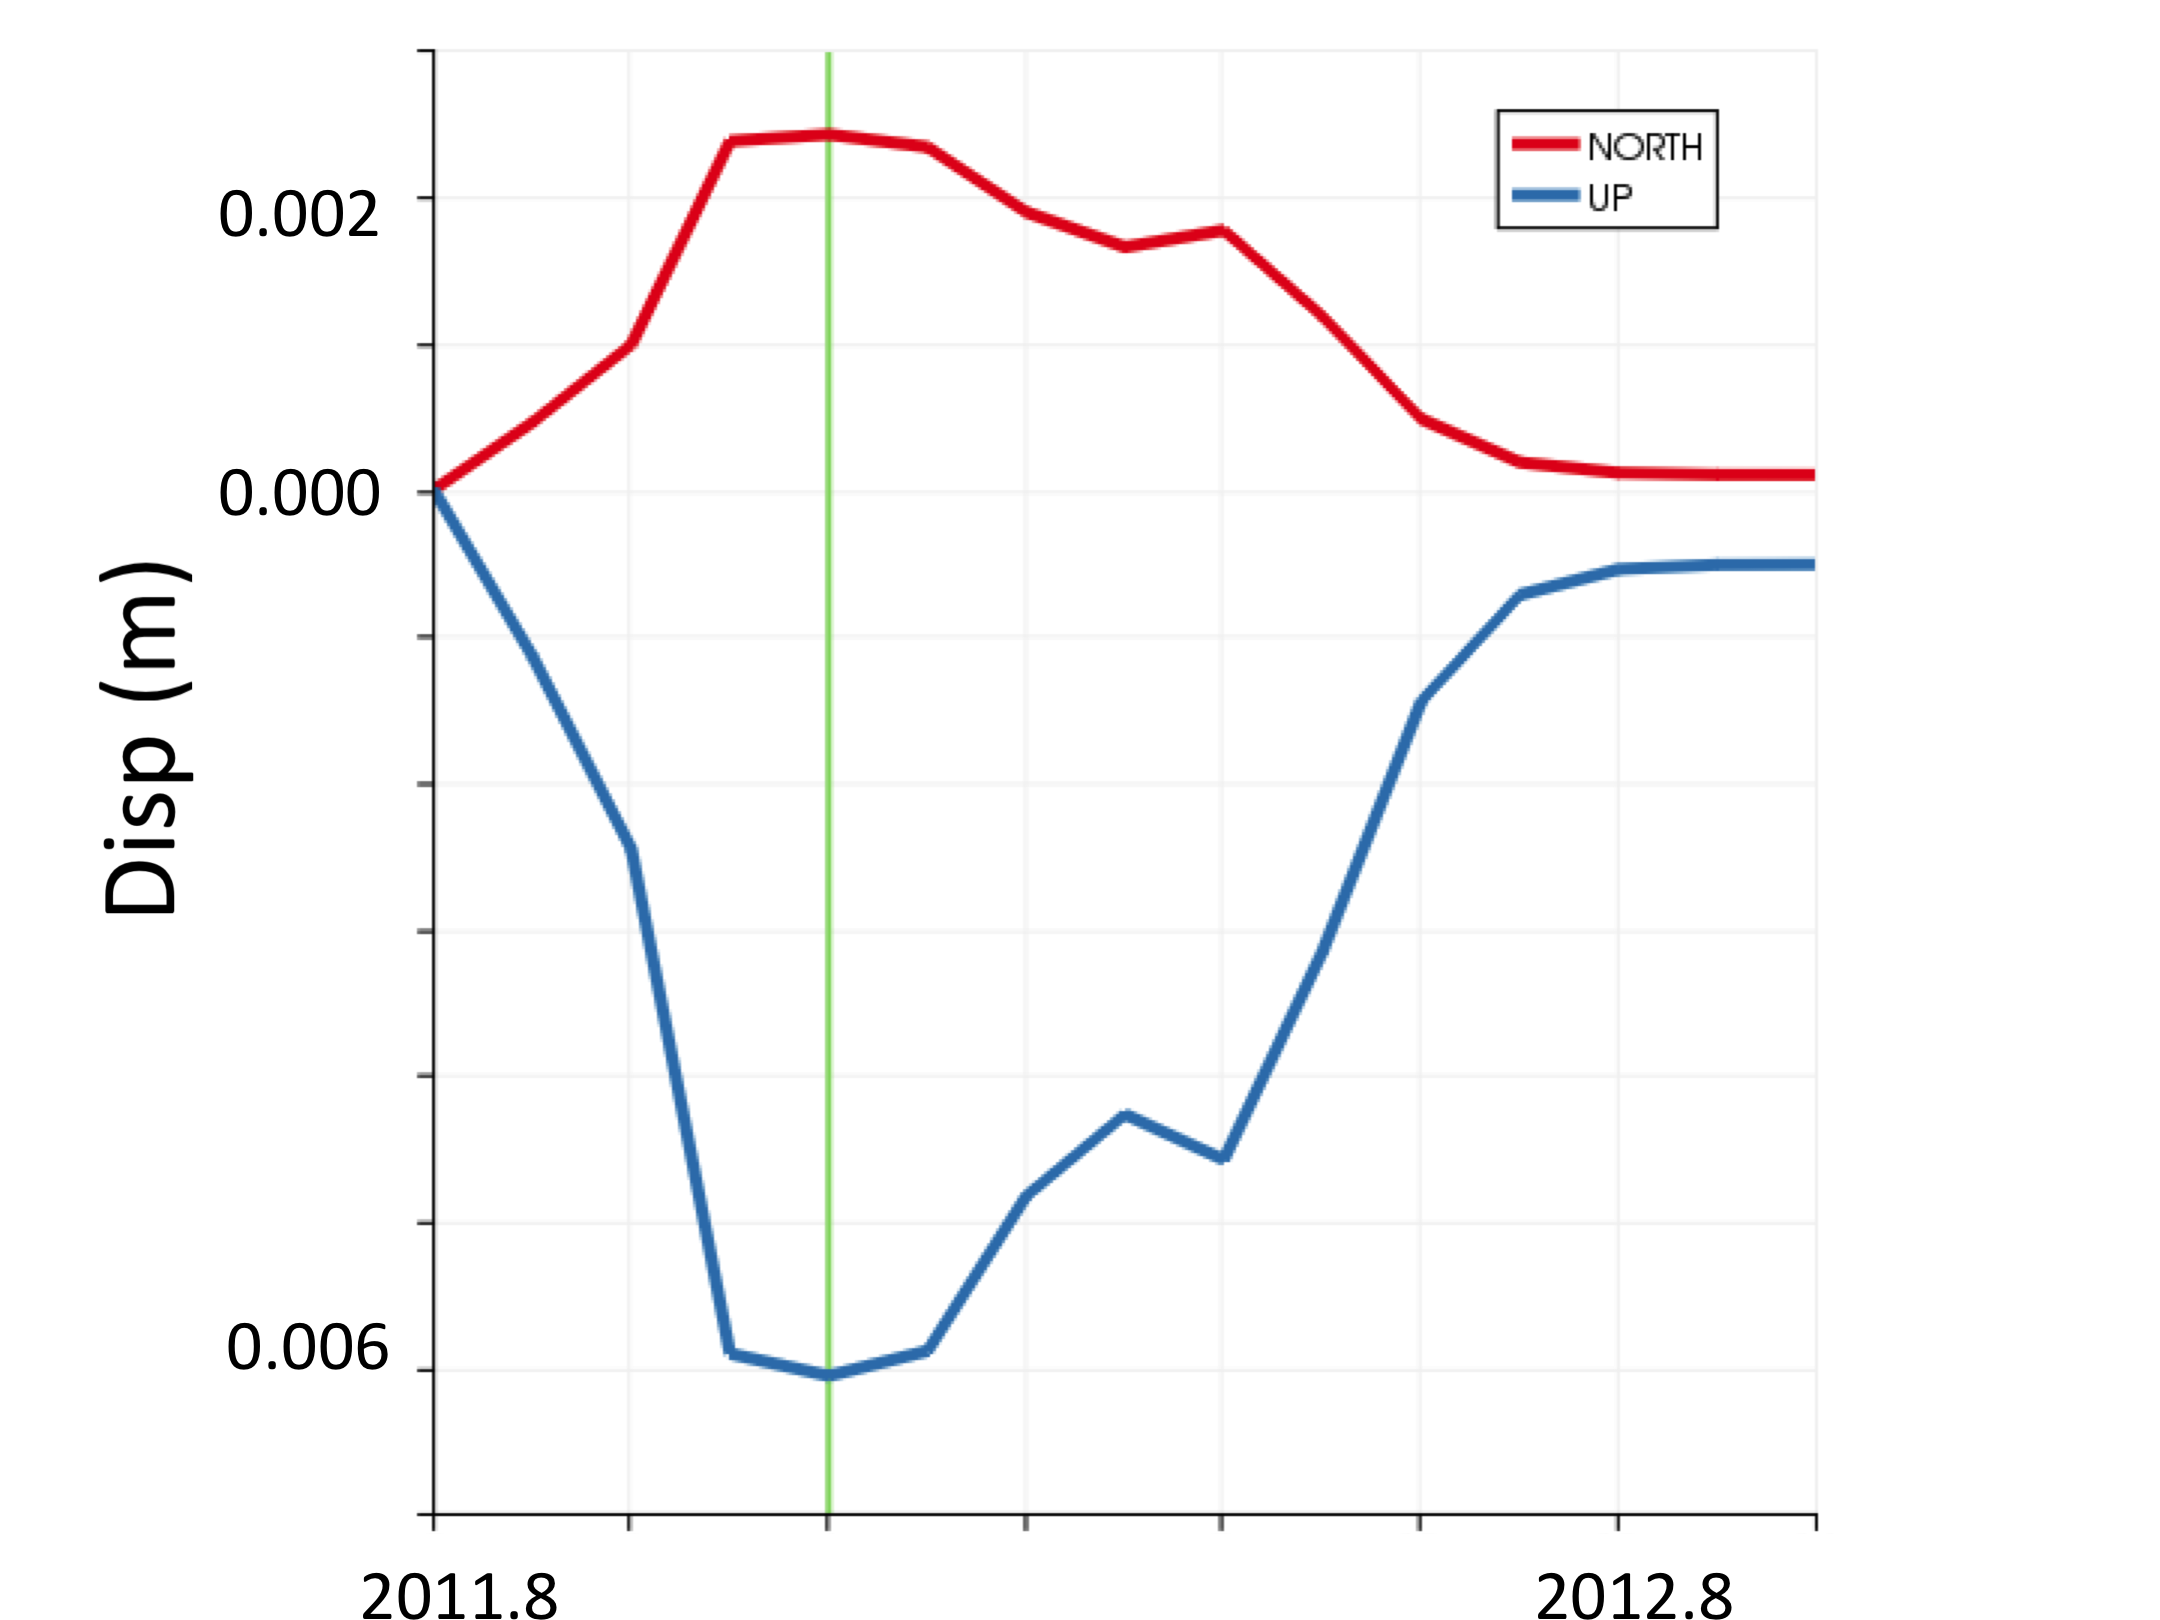
Scientists have been making summer-time geodetic measurements in south central Alaska for decades to estimate the rate at which a continental-ocean terrane is accreting to the North American continent. Southern Alaska has big earthquakes every century and large, rapidly changing glaciers. In the last decade, primarily as part of the EarthScope Plate Boundary Observatory project, continuous GPS measurements have recorded the response of sites such as the near-coastal geodetic site, AB35 to competing processes: uplift and movement to the northwest due to tectonic forces and the response of the solid Earth to seasonal and longer-term changes in the cryosphere (snow and ice) surrounding the site. Which process causes the largest displacements of the site? Figure 1 (Blewitt, Nevada Geodetic Lab, 2015) shows the Northward, Eastward, and Upward motion of AB35 between 2007 and 2015. The site is moving rapidly to the north and west reflecting the tectonic convergence of the site toward interior Alaska but there is small wiggle on the North component reflecting seasonal displacements of the site associated with snow loading and unloading. However, the Up component, shows a large seasonal signal due to snow loading in the winter (down) and ice and snow melting in the warmer months (site goes up). Between 2007 and the present, the site position is slowly moving upward, due to tectonic forcing but probably associated with longer-term ice melting as well. We are using the CIG finite element modeling (FEM) program PyLith to estimate the surface displacements and stresses associated with seasonal loading changes (Figure 2 and Figure 3) for water year 2012, 2011.8 – 2012.8) and the longer-term retreat of the surrounding glaciers.
Jeanne Sauber, NASA Goddard Flight Center