Loading
![]()
![]()
A team at the Seismic Sound Lab (http://www.seismicsoundlab.org) constructs representations of global seismic waves through sound and animated images. The animated images are renderings made with “yt” of simulations using the CIG-hosted code SPECFEM3D_GLOBE. The sounds are time compressed seismic data with minimal additional processing. Synchronizing the sounds and images reveal complex patterns and illustrate numerous aspects of the seismic wave field bringing new insights to both the public and, hopefully, researchers.
At the global scale, the SPECFEM3D_GLOBE code can model wave fields with a broad range of frequencies, for realistic crustal structure. The python environment “yt”, designed to process, analyze and visualize volumetric data in astrophysical simulations, is adapted here to spherical geometries relevant to seismology. To visualize this data, techniques used in the visualization of astrophysical phenomena such as star formation and galaxy evolution were applied to the seismic wave fronts. The visualization was created using a volume rendering technique, wherein an image plane traversed the volume and at each step in the traversal the individual pixels of the image were evolved according to the radiative transfer equation, accumulating from absorption and attenuating due to emission, as shown in the figure. Colormaps are constructed using Gaussian and linear functions of RGB values and are mapped to the amplitude of net displacement in each voxel and time step. In a given filter, the color shows the radiative value (local emission at each point) and the curvature of the top of the filter shows the alpha value that describes the transparency (alpha=1 is completely opaque, alpha=0 is completely transparent). The combination of the color map and the alpha function is called the transfer function. This approach results in a smooth highlighting of specific displacement values throughout the volume, illustrating the global wave field for one time step. The example snapshots shown in the above figure were generated from a SPECFEM3D_GLOBE simulation of the 2011 Tohoku Magnitude 9.1 earthquake (USGS finite fault model).
A basic pedagogical exercise is to visually and sonically distinguish between surface waves and body waves. To demonstrate this difference, using the data and the simulation from the Tohoku earthquake, our initial efforts involve filtering both the images and the sounds in parallel. To make the sounds, we run a low pass and high pass filter on the seismic data, above and below about 1.0 – 0.5 Hz. The surface waves clearly propagate as a wave packet, and the coherent motion is clear when listening in spatialized sound environments. To make the images, we apply different transfer functions centered on different bands of displacement amplitude, as shown in the figure. The larger displacement amplitudes correspond to the lower frequency surface waves (right column), with a transfer function designed to look like a plasma. The smaller displacement amplitudes correspond to the higher frequency body waves (left column), with a transfer function designed to render semi-transparent, semi-reflective sheets moving through space (a bit like a jellyfish). The wave fields, when separated like this, look very different and sound very different. Furthermore, the movies with sounds play back at different speeds. The surface wave movies actually have to be shifted more to be in the audible range and thus play back faster than the body wave movies. The synchronization is tight; the sounds correspond to events in the wave motion, and the meaning of the two aspects of the wave field becomes clear. However, much potential for improvement remains in the development of quantitative relationships between the audio and image filters, such that we can explore the behavior of narrower frequency (band-pass) aspects of the wave field.
Contributed by Ben Holtzman
This work is directly supported by NSF grant EAR-1147763, “Collaborative Research: Immersive Audio−Visualization of Seismic Wave Fields in the Earth (Earthscope Education & Outreach)” to Ben Holtzman (LDEO), Jeroen Tromp (Princeton) and Denton Ebel (American Museum of Natural History) and NSF grants ACI-1339624 and ACI-1048505 to M. Turk. Daniel Peter and Matthew Turk acknowledge that the work presented here was substantially performed at the TIGRESS HPC center at Princeton University (PicSciE), and facilities at the Swiss National Supercomputing Centre (CSCS). http://www.ldeo.columbia.edu/~benh/papers/Holtzman_CMMR_bookREV.pdfB.K. Holtzman, J. Candler, M. Turk and D. Peter, “Seismic Sound Lab: Sights, Sounds and Perception of the Earth as an Acoustic Space”, Lecture Notes in Computer Science (Springer Verlag), in press.
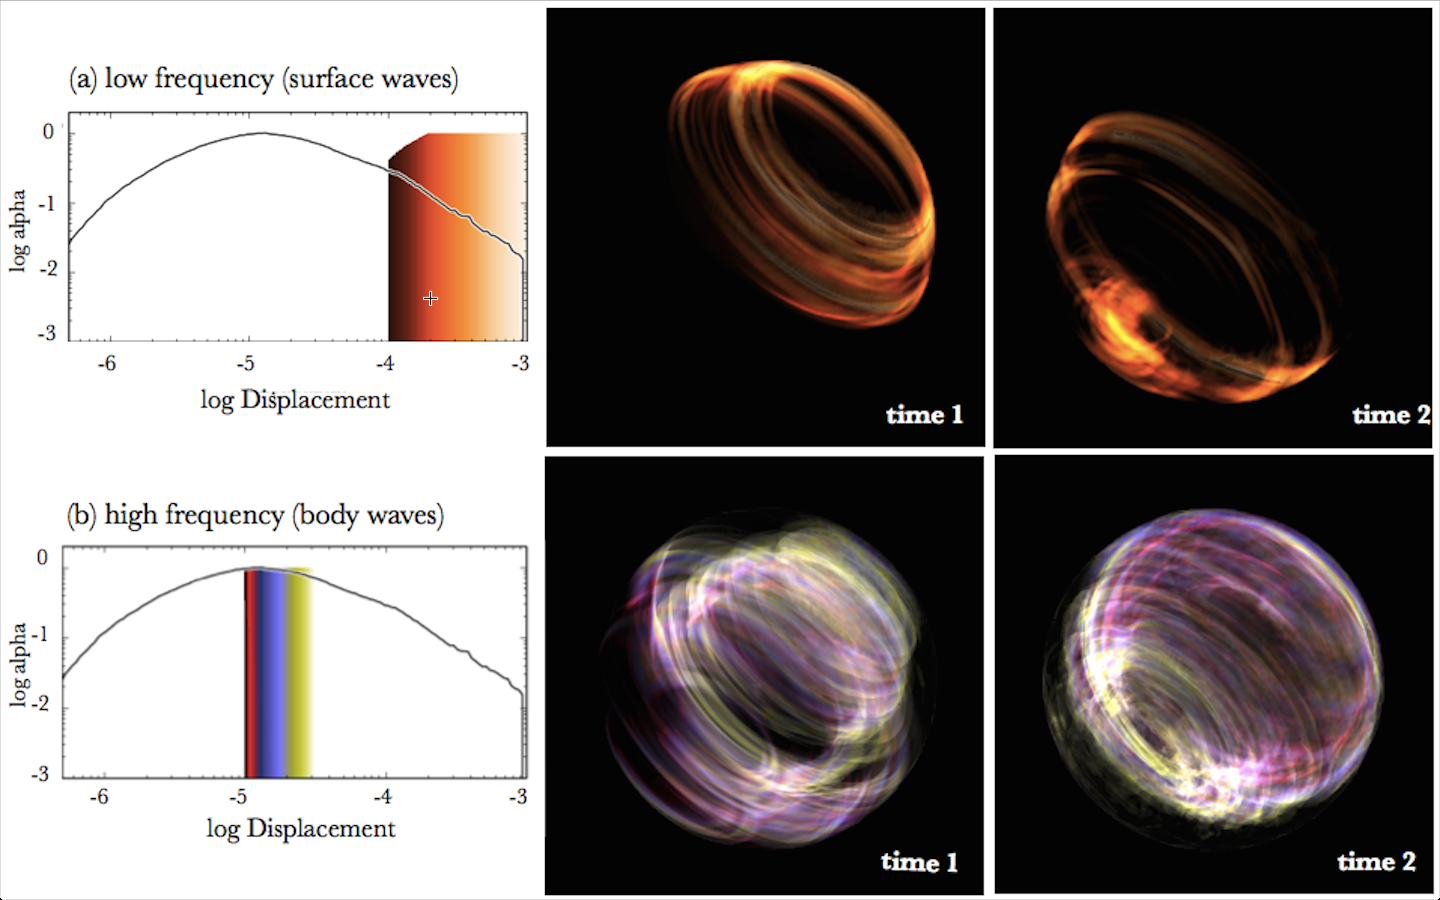
Animated images of the global seismic wave filed from the 2011 Tohoku Magnitude 9.1 earthquake. High pass (bottom) and low pass (top) filtering illustrates the propagation of the body and surface wave fields, respectively, through and around the earth. The multi-sensory perception of these complex phenomena may bring new insights to researchers. The movie can be found at: http://www.seismicsoundlab.org/?p=105. This material was developed for the SeismoDome program at the Hayden Planetarium, at the American Museum of Natural History, New York City. Animated images of the global seismic wave filed from the 2011 Tohoku Magnitude 9.1 earthquake. High pass (bottom) and low pass (top) filtering illustrates the propagation of the body and surface wave fields, respectively, through and around the earth. The multi-sensory perception of these complex phenomena may bring new insights to researchers. The movie can be found at: http://www.seismicsoundlab.org/?p=105. This material was developed for the SeismoDome program at the Hayden Planetarium, at the American Museum of Natural History, New York City on November 17, 2014